
Hi Pierre,
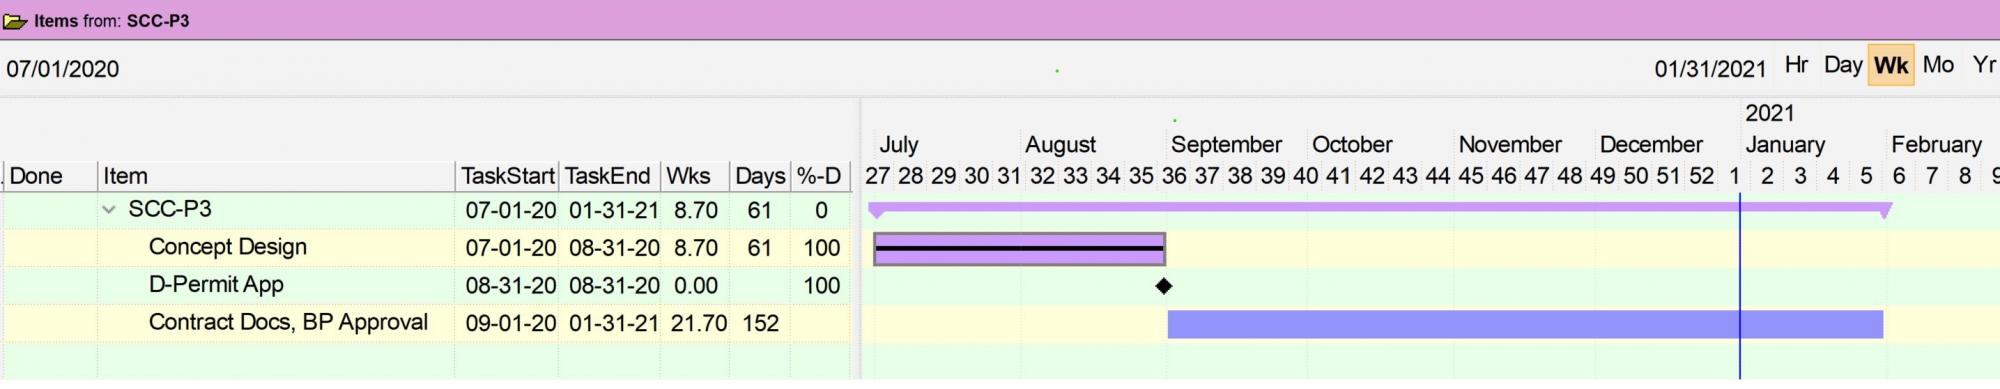
The Gantt Chart updates the Summary Task Bar Duration but not the Weeks Duration cell nor the Days Duration cell. See pasted image below, where 'SCC-P3' Summary Task 'Wks' column is stuck on 8.70 and 'Days' on 61. I've tried every setting-change and trick I can think of with no success, including refresh, closing/reopening the Grid, closing/reopening InfoQube, deleting/rebuilding the entry items, upgrading from 9.116.m to 9.117Pre1.
Gantt Bar color selection disconnect: the color selection for individual bar color per 1st pasted image below (lavender chosen), vs setting the bar default color via grid settings per 2nd pasted image below - there is no correlation between the two methodologies for choosing color, the appearance is different, the displayed colors are different, there is no 'lavender' color to choose from via grid settings. Furthermore, when I copy/paste the lavender numerical ID # from Item Properties into the Grid Bar Default Color box, the pasted # won't stick. Ergo, although by right-clicking on a bar I chose lavender as that bar's color, I can't figure out how to make lavender the bar default color.


thanks
Doug Bartlett
Comments
Hi Pierre, I believe I…
Hi Pierre,
I believe I resolved the issue with Summary Task row "Task Duration" field/cell not updating in Gantt Chart.
Manage Fields > Task Duration > Equations > Column Equation: Set first DropDown Menu Box to "Parents" and second to "SUM". They both used to be blank, for whatever reason.
Task Duration field/cell in the Summary Task row seems to be updating fine now. No unintended consequences that I've noticed so far.
take care, Doug
Good Morning Pierre, Last…
Good Morning Pierre,
Last night, while preparing for a presentation for which I intended to use the Gantt Chart feature, I discovered that in Day View the end of the Bar falls one day short of the TaskEnd Date. See image below, where the tasks beginning with "P-1" all end on Fridays per the TaskEnd Date, but the Bar ends the day before on Thursday. If I change TaskEnd Date to Saturday, then the Bar extends to Friday. Related to that, Duration Weeks and Days isn't right, look at Macleod DR or Courtyard Door for instance where per TaskStart and TaskEnd input dates the timeframe should be 3.0 weeks and 15 days, but they're 2.0 and 14.
I investigated the various Gantt Chart settings but couldn't see any obvious issues or fixes. I hid non-working days (weekends) but that didn't help.
Hoping you might have some ideas.
thanks, Doug
Hi Doug, Currently, unless a…
Hi Doug,
Currently, unless a time is specified, all dates refer to hour 0, meaning midnight, so a task starting on April 1st starts at 2021-04-01 0h00 and if it ends on April 20th, it ends on 2021-04-20 0h00 too. It of course appears to end on the 19th...
Suggestions ?
Pierre_Admin
Morning Pierre, For me, as a…
Morning Pierre,
For me, as a construction project manager, if I've got a project task starting on a Monday and ending on a Friday, that means 5 working days including the entirety of the Friday, which is how I need the Gantt Bar to illustrate the task timeline.
What if TaskEnd was recalibrated to the 59th minute of the 23rd hour of the end date. I'm not a programmer guy, but I think that would then include the entirety of the end day.
What I don't know is if that recalibration would cause other unintended consequences inside InfoQube.
thanks
Doug
Hi Pierre, Is there an…
Hi Pierre,
Is there an equation I can enter into a field setting somewhere, somewhere in TaskEnd for instance, that would make the adjustment so that the Gantt Bar would fill to the end of the TaskEnd day instead of only to the beginning? Without there being unintended consequences elsewhere in InfoQube.
thanks, Doug
Hi Doug, I've been thinking…
Hi Doug,
I've been thinking about your problem. It seems that there are 2 large groups of applications that can use Gantt charts (if someone thinks of another, please chip in). Consider an item that starts on Jan 1 and ends on Jan 2:
We must find a way to reconcile these two in the most elegant way (i.e. without having to enter start/end times)
Any thoughts ?
Hi Doug, I'm testing a new…
Hi Doug,
I'm testing a new Gantt property: End Date assumes: One of Start of day or End of day
Stay tuned !
Hi Pierre, Excellent…
Hi Pierre,
Excellent examples of the two different perspectives, I understand better your dilemma now.
Ability to toggle end date between start-of-day or end-of-day sounds like real reasonable solution.
Staying Tuned with great anticipation!
thanks
Doug
Hi Pierre, THANK YOU for…
Hi Pierre,
THANK YOU for adding the option in v117 for Gantt Tasks to end at end-of-day.
Works slick as a whistle!
Doug
Hi Pierre, new Gantt Chart…
Hi Pierre, new Gantt Chart Question - in a Gantt Chart Grid, is it possible to hide a row(s), similar to hiding a row(s) in Excel?
For instance, in the Gantt Chart below, I'd like to make it public but hide the two rows "Gord Gone", because it's internal tracking info, not for the public.
(also, how do I resize the picture below after inserting it, it only needs to be half as wide but I'm not finding a way to reduce it dimensionally after inserting it? I did reduce the file size by half and then reinserted it, but the width didn't reduce)
thanks, Doug
Hi Doug, You could select…
Hi Doug,
Pierre_Admin