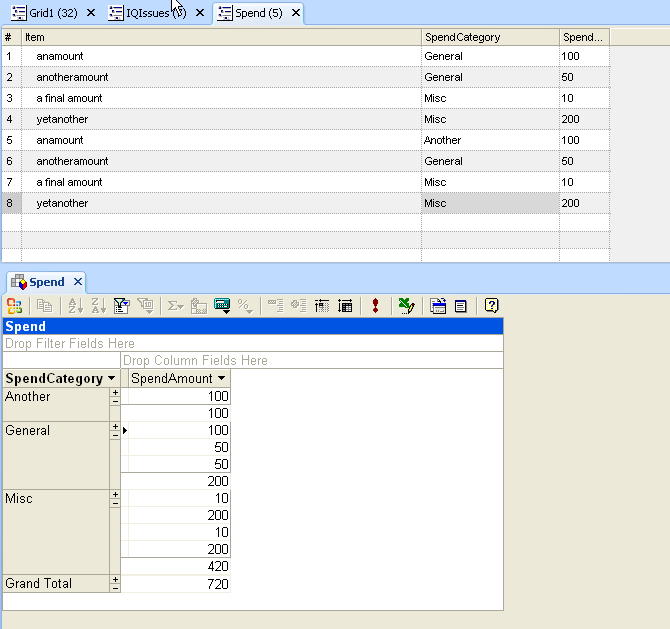
a) When you do a pivotable like below with SUMS of fields, you would expect it to show only totals rather than line level detail of each amount. If I had pulled the descs in it would be different as it would 'group by' those also. You can click the little minus sign for each one but that would take a long time on larger pivotables.

b) Also if you close IQ with a pivot open the pivot does not auto-reopen like a grid would, is this intentional? It does retain settings though which is great news.
cheers
Comments
Show or hide detail data for an item or field
To show or hide detail data for a cell, or an item at the lowest level, select the item or cell.
Note To show or hide lower-level items, select the row or column field or item, and then click Expand or Collapse
  on the toolbar.
[/quote]
The Show detail and hide details buttons are between the expand / collapse and the refresh (!) buttons
b) Yes, by design. Currently, pivot tables/charts must be opened from a grid, you can't open a pivot table/chart directly