I like to use charts to display info in a spreadsheet format - eg:
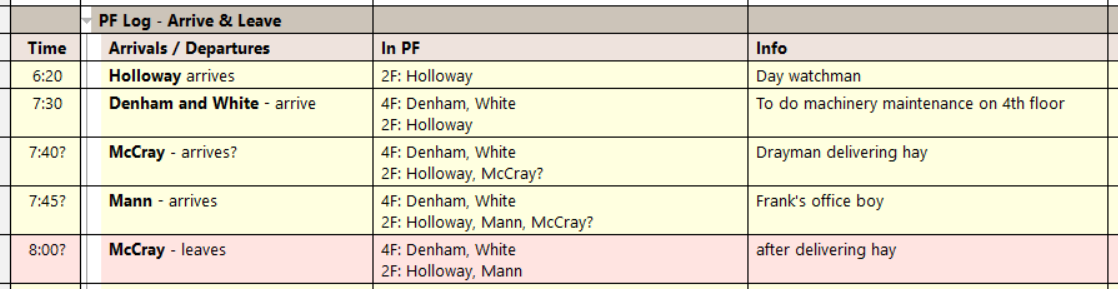
Different charts require different column widths, therefore you cannot consolidate your charts in one grid. Excel has the same issue.
The only solution I see is creating a new grid for each chart. This will obviously result in many grids (probably 200-300 for my current project).
One poster said he went down the path of "many grids" but abandoned it. He didn't explain why.
1) Is there a reason to avoid making many grids?
2) Is there an alternative approach to solving the need for varying column widths?
Wayne
How do I ?
Comments
Hi Wayne, There is no issue…
Hi Wayne,
There is no issue in creating hundreds of grids. I'd like to understand what you mean by a "chart" For me, a chart is like a pie chart, bar or X-Y...
In your example, what I see is a "table" with color coded lines
Thanks, Pierre. The…
Thanks, Pierre. The definition of "chart" includes tables.
Free Dictionary: Chart = "3. A sheet presenting information in the form of graphs or tables"
https://www.thefreedictionary.com/chart
Merriam-Webster: Chart = "a sheet giving information in tabular form."
https://www.merriam-webster.com/dictionary/chart
Got it. So you'd like to…
Got it. So you'd like to have a way to set column widths or more than that?
I had two questions: 1) Is…
I had two questions:
1) Is there any issue with creating hundreds of grids? (you've answered that).
2) Is there another approach to this problem that doesn't involve creating a separate grid for each chart?
I asked #2 just to cover my bases and make sure I've looked at all possible solutions.
I looked at using one grid and loading different column sets for different charts, as needed.
Also considered using one grid and manually adjusting column widths as needed for different charts.
Both would be impractical.
I'm fine with the "many grids" solution and will go forward with that.
Wayne
I like the idea of saving…
I like the idea of saving column sets (including column widths) to a file, of which you can have as many as you wish.
Would that work for you ?
Last time I tried column…
Last time I tried column sets they didn't preserve the location of the items column and did not preserve grouped columns. But I'll give them another look.
Wayne