Changing symbols enclosing auto-list of values

Submitted by Tom on 2017/03/29 09:44
A problem when changing symbols enclosing auto-list of values:
 
formerly I used curly brackets, i.e. they were {value}
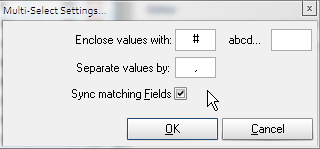
I decided to change them to #value (see screenshot)
I am left with a list like this:
  • #film},#font},#Layout},#Scan}
I want to get rid of the trailing bracket
 
 
  1. am I doing something wrong, or misunderstanding how this works?
  2. with an auto-list of values, there appears to be no way to correct the entries?
TIA

Shift+Return Problem when Pasting Multiple Lines

Submitted by Tom on 2017/03/29 09:16
Let's say I copy 10 cells, and want to paste them into a selected cell and have nine new items created for the following items.
One of the items though has a shift+return to create a new paragraph within the cell.
This gets treated by IQ the same as a return.
So I end up with 11 items instead of 10
 
1) would it be possible that this type of return be ignored ?
2) would it be preferable to others (as well as to me) ?
 
(I realise there is the merge / join items workaround.)

Scroll Bar Bug

Submitted by David_H on 2017/03/26 14:03
This is a bug I haven't experienced in forever, but it seems to have crept up again with one of the recent releases.  The screenshots say it all, let me know if you have any questions.  As soon as the grid exceeds 1100 or so pixels wide the scroll bar disappears. 
 
 
Edit: changing the grid width resolves the issues SOMETIMES.  At other times it does not.  Sometimes I have to resize the entire IQ window so it's not maximized to get the scroll bar back.
 
This is a 4K monitor with no scaling, in case that's one of the variables.

Favorite Items

Favorite items provide a way to easily access items you use most. The list is saved in the field Favorites.
 

1. Setting an item as a Favorite item

Select one or more items and:
  • Do Item > Favorite to set as a Favorite
  • Set the Favorites field (Properties pane)

Gantt Charts and Project Management

When it comes to Project Management, InfoQube is not as sophisticated as specialized tools like Microsoft Project or Primavera, but it nevertheless provides extensive project management tools. One of which is sophisticated Gantt charts:
 
 
Being fully integrated with the rest of InfoQube, its Gantt Charts are in some ways even move useful than those of the "big guys" !
 

1.

Sub-Views

IQ also has other means to view your data. These views are called sub-views as they are alternate display of grids. That is, one typically opens a grid and then selects an alternate view:
  1. Card View
  2. Map View
  3. TimeLine View
  4. Pivot Table View
  5. Pivot Chart View
These sub-views are linked to a given instance of a grid. This means that if you have 2 instances of a grid opened, showing different sets of items (with say different filters), each sub-view use the items in those grids.