IQ Training Session #12: The many uses of the Find and Filter dialog
Forums
The next Group Training Session will focus on the many uses of the Find and Filter dialog:
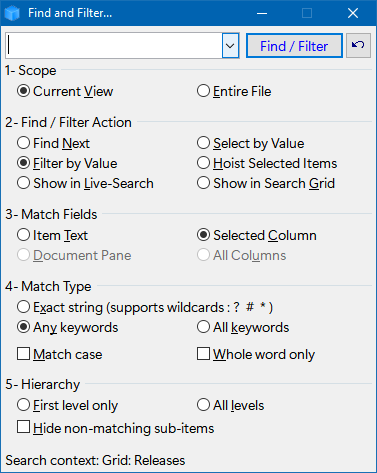
The Find and Filter dialog is the "jack of all trades" when it comes to finding items in your IQBase: