NB: This documentation is based on Mantis entries:
Gantt Chart (first version) | |
Task Dependencies | |
Gantt chart enhancements (hours view, better date header display) | |
Gantt: Switching between tasks and milestones | |
Gantt: Add option to set non working days | |
Gantt: Scale not saved | |
Add overload capabilities to the Gantt | |
Gantt enhancements | |
Gantt charts - Show overview and histogram checkbox | |
Gantt chart: No need to set the End Date and Duration fields | |
Grid: Item color: add option to select which columns are shown in that color | |
Gantt chart: add option to set bar colors |
It also incorporates material from the Wikipedia articles on project management and on work breakdown structure.
InfoQube is often used in the planning and monitoring of activities made up of constituent individual actions. An example of an activity is a simple one-off task, such as "sell car". The activity is fairly clear in scope, and any associated planning is probably quite simple. A typical way of doing this in InfoQube is to create an item called "Sell car", and to create child items – individual actions – in a hierarchy below that item, such as "Service car", "Advertise car", etc.
Sometimes activities, made up of interdependent actions, are sufficiently complicated to merit being treated as:
- Either ongoing processes or operations - these are activities which are frequently repeated following a more-or-less well-defined process design or template. Thus if you collect cars and sell lots of them, it might be worthwhile to define an InfoQube form as a template for the repeated activity.
- Or as a one-off but perhaps complicated project.
As a working definition of a project, Wikipedia suggests:
"
A project is a temporary endeavour, having a defined beginning and end (usually constrained by date, although it can be by funding or deliverables), undertaken to meet unique goals and objectives, usually to bring about beneficial change or added value. The temporary nature of projects stands in contrast to business as usual (or operations), which are repetitive, permanent or semi-permanent functional work to produce products or services. In practice, the management of these two systems is often found to be quite different, and as such requires the development of distinct technical skills and the adoption of separate management.
The primary challenge of project management is to achieve all of the project goals and objectives while honoring the preconceived project constraints. Typical constraints are scope, time, and budget. The secondary—and more ambitious—challenge is to optimize the allocation and integration of inputs necessary to meet pre-defined objectives.
"
Wikipedia discusses project management in general terms. The scope of a project which can effectively be managed using InfoQube is restricted to projects carried out only by a small number of people - usually one. Furthermore, IQ provides no explicit support for PERT or CPM approaches.
The diagram illustrates the main stages in managing a project:
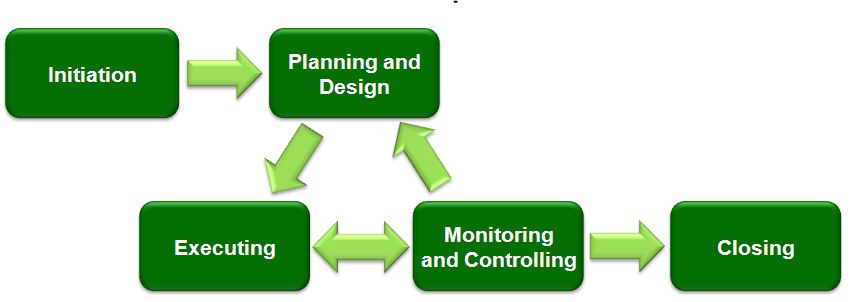
Source: Wikipedia Commons http://en.wikipedia.org/wiki/File:Project_Management_%28phases%29.png
The management of any project should be planned in two stages. These are:
- Identify the Work Breakdown Structure – in essence, what are the outputs, the deliverables, required from the project.
Plan the Project Schedule – how and when the various actions required to create the outputs will be carried out.
The Work Breakdown Structure (WBS)
The first stage in the planning of a project should be the identification of its work breakdown structure (WBS). The Work Breakdown Structure is a tree structure, which shows a subdivision of the outputs required to achieve an objective; for example a program, project, or contract. The WBS tells us WHAT elements ("deliverables") are necessary to plan, execute, control and close a project, while the (subsequent) project schedule will tell us HOW we plan on creating each of those deliverables. In this context, the WBS should always represent exactly 100% of the approved scope (deliverables) of any project.
It is important to understand that the WBS shows only WHAT the deliverables are. It does not (or should not) show the structure of the deliverables, that is HOW they are individually constructed. It makes perfect sense to do that too using IQ, but the WBS should not be confused with that product structure. Nor should the initial creation of the WBS be confused with the subsequent stage of project scheduling, which identifies the schedule of tasks and their interdependencies – the WHEN. It is considered poor practice to construct a project schedule before designing a proper WBS. So the WBS is neither a project plan, nor a schedule, nor a chronological listing.
In a project or contract, the WBS is developed by starting with the end objective and successively subdividing it into manageable components in terms of size, duration, and responsibility (e.g., systems, subsystems, components, tasks, subtasks, and work packages). Thus it includes all deliverables necessary to achieve the objective. This may take the form of a tree structure.
The most obvious way in which to model a tree structure in InfoQube is of course as a hierarchical outline. However, this is not actually necessary in order to plan a project nor – subsequently - to represent it as a Gantt chart.
The Work Breakdown Structure provides a common framework for the natural development of the overall planning and control of a project or contract and is the basis for dividing work into definable increments from which the statement of work can be developed and technical, schedule, cost, and labour hour reporting can be established.
A work breakdown structure permits summing of subordinate costs for tasks, materials, etc., into their successively higher level “parent” tasks, materials, etc.
For each element of the work breakdown structure, a description of the task to be performed is generated. This technique is used to define and organize the total scope of a project.
The WBS should initially be organised around the primary products of the project (or planned outcomes) instead of the work needed to produce the products (planned actions). Since the planned outcomes are the desired ends of the project, they form a relatively stable set of categories in which the costs of the planned actions needed to achieve them can be collected.
An outcome determines a so-called terminal element of the project, that is, an activity which delivers that outcome. A well-designed WBS makes it easier to assign each project activity to one and only one terminal element of the WBS, which is desirable in phased projects which deliver multiple outcomes and for which – for example – separate costings / billing items are required or desirable as part of the process of accounting for project costs.
A Gantt chart is a type of bar chart that illustrates a project schedule. InfoQube has a Gantt view, which includes a Gantt chart.
Gantt charts illustrate the start and finish dates of the terminal elements and summary elements (intermediate elements) of a project. Terminal elements and summary elements derive from the work breakdown structure of the project. Gantt charts can also show the dependency (i.e. precedence network) relationships between activities. Gantt charts can be used to show current schedule status using percent-complete shadings. Gantt charts have become a common technique for representing the phases and activities of a project which carries out a work breakdown structure (WBS), so they can be understood by an audience which is wider than the person who is planning the work.
InfoQube cannot pretend to the advanced project management capabilities present in dedicated project management software such as Microsoft Project. However, IQ does include powerful work management capabilities which, crucially, can easily be integrated with the other information management needs of individuals. This documentation assumes that InfoQube is being used to manage the activities associated with one person carrying out a complete project. The size of an action is measured in person-days of effort (although the Gantt view supports all of hours, days, weeks and months). Normally, its duration is determined by its start date and its end date; however, it is no longer required to set the Gantt chart End Date and Duration field. An action which takes zero time is called in IQ a milestone; it is represented not as a line in Gantt view, but as a lozenge.
In a project schedule, dependencies between actions are identified. Where one action cannot start until one or other earlier actions have been completed, the action has a dependency upon those actions.
The implementation of projects in IQ usually involves a combination of specific IQ features. These are:
- Gantt View. This can be enabled for any grid, although typically it is used with a Projects grid. To toggle Gantt view on or off for a given grid, used Grid / View Gantt. To set the Gantt-related properties for a grid, use Grid / Properties and open the Gantt Chart properties for that grid.
- A set of system fields.
The system fields include:
Field N°. | Field name | Type | Caption in grids | Notes on field behaviour |
90 | TaskActStart | Date | TaskActStart | |
91 | TaskActEnd | Date | TaskActEnd | |
| 93 | NextTaskDelay | Number | ||
94 | TaskDuration | Number | Nb Days | |
95 | Task%Complete | Number | % Done | |
96 | TaskEffort | Number | TaskEffort | |
97 | TaskID | Number | TaskID | |
98 | NextTaskID | Text | NextTaskID | |
| 99 | TaskBarColor | Text | ||
| 100 | TaskIsSummary | Yes/No | ||
| 101 | TaskBarCaption | Text |
Part of the flexibility of IQ is that it is not necessary to stick to a strictly hierarchical breakdown of work. Thus an element of one project may equally be used as an element of a second project.
One thing which is essential to effective project planning in IQ is grouping together tasks which together constitute a project. It might therefore be sensible to represent the project as a tree structure of hierarchically-linked tasks and their sub- and sub-sub- tasks. However, this is not in fact the way in which IQ shows how tasks are related. Instead, IQ permits task dependencies to be represented and stored explicitly. One task can depend on more than one other task, and one task can precede more than one subsequent, dependent, tasks. Thus, it is only by convention that tasks and sub-tasks are represented as a hierarchy, and IQ ignores the tree structure when considering dependencies. Instead, it relies upon the use of the two system fields TaskID and NextTaskID to show how each task relates to others.
Traditionally in project management, project tasks are labelled using letters. However, IQ uses the numerical system field TaskID to identify individual tasks which participate in dependencies and the system field NextTaskID to store dependencies. In fact, the NextTaskID field can be used to identify several “next” (dependent) tasks since it takes the form of a comma separated list. It should be noted that when a dependency is established, completely new values are created for TaskID and NextTaskID - they have nothing to do with the IDItem field associated with all IQ information items.
The standard sample database contains a project called Somiro. The screenshot which follows is taken from such a sample database.
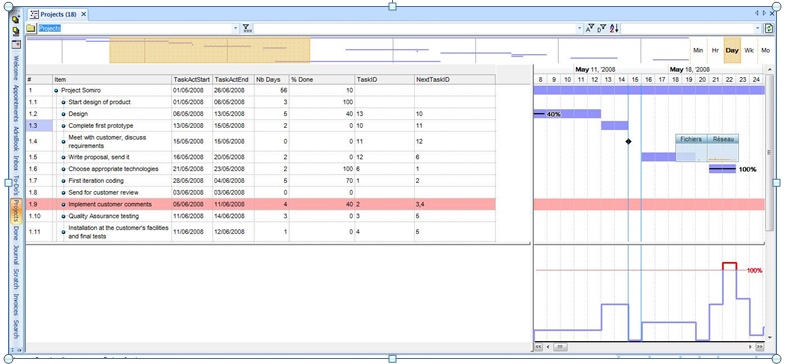
In the screenshot we can see the following elements:
- A TLI (top level item) ‘Project Somiro’ and its constituent tasks, here labelled 1.1 to 1.11; this grid shows the principal fields needed to implement a Gantt chart in IQ; these fields are discussed below.
- Above the grid is shown the project overview – this extends over the whole length of the project, which is here all of May and most of June 2008; it is shown if the Gantt Chart property Show Overview is set; the scale of the display can be set to one of Min, Hr, Day, Wk, Mo (minutes, hours, days, weeks, months).
- To the right of the main grid is shown the magnified detail Gantt view of the tasks which are active in a particular seventeen day period; the part of the project which is currently displayed is indicated by orange shading in the project overview described in the previous element.
- Below the detail Gantt view is the resource utilisation histogram; it is shown if the Gantt Chart property Show Histogram is set.
Right-clicking the date line at the top of the Gantt view displays a menu which permits the Show Overview, Show Histogram and Zoom parameters to be changed; Gantt properties are also accessible from this menu.
Gantt charts are good for project management, but they can also be used for other things, since:
1. The amount of scaling is under user control.
2. The current time is shown as a green vertical bar in the minute, hour and day scales.
3. If you double-click on the header, the chart is centred to the current date/time.
4. If you double-click on the chart on an item line, the chart is centred on that item bar.
5. Using the mouse-wheel when over the Gantt scrolls the chart
left-right if Ctrl is held simultaneously
zoom in-out if shift is held simultaneously;
the page scroll buttons makes larger up and down movements.
If you are using a tablet, when over the Gantt scrolls the chart
left-right if Ctrl is held simultaneously
zoom in-out if shift is held simultaneously;
the page scroll buttons makes larger up and down movements.
6. As the user moves the mouse (just below the date headers), a Date Ticker is shown.
Moving items: To move items, you must be very careful to select the bar in the middle and move left or right, etc...
Linking items: In order to link one item to another so that it becomes a precessor, you press the Shift when you first click on a bar:
Press Shift
Click on the first bar
Let go Shift (if you hold the Shift key too long, it stops linking)
Drag to the second bar
Grid: Item colour: an option has been added to select which columns are shown in that colour.
Currently, the item back colour is set to all columns. This is sometimes not desired (in particular with the new Gantt chart bar colour). The new option permits setting the list of fields which show the color; it should be left blank to color the whole item:
Additionally, in a Gantt chart: an option has been added to set Gantt item bar colours. The steps necessary are these:
1. Grid>>Properties>>Gantt Chart>>Bar color field : set it to field containing the color (by default, the ItemColor field is used)
2. Set the values for the bar colours (using ItemColor field is easy because IQ has context menus to set this field)
These are set using Grid / Properties, then opening the Gantt Chart properties, which are:
Field | Default values | Notes |
Start Date Field | TaskActStart | |
End Date Field | TaskActEnd | |
Duration Field | TaskDuration | |
Percent Done Field | Task%Complete | |
| Bar caption field | TaskBarCaption | |
Effort (in days) Field | TaskEffort | |
| Bar color field | TaskBarColor | |
| Bar default color | &H00FB9492& | Light gray-blue |
Show Overview | Yes | Determines whether the Overview element of Gantt view is displayed |
Show Overview zoom buttons | Yes | Determines whether zoom buttons (displacement left, earlier; or right, later) are displayed; this option is only available if Show Overview is set |
Show Histogram | Yes | Determines whether the Histogram element of Gantt view is displayed. The Histogram shows the extent to which the individual whose work is being planned is committed; if the figure exceeds 100%, it indicates that, for example, it will be necessary to work overtime |
Non Working Days | Used to select days of the week which are not worked (e.g. Saturday and Sunday) | |
Non Working Hours | Used to select hours of the day which are not worked (e.g. 12AM to 08AM, implying that the working day starts at 09:00) |
If you set your grid source to your Gantt Start date field (normally TaskActStart), the DateFilter toolbar can then be used to limit the items displayed. This is useful to view just what you want, to reduce crowding in the overview area and it also helps when printing.