Case: You want to better manage your personal finances
Solution: Use InfoQube to enter revenues and spendings. Use InfoQube or Excel to calculate balances and perform analysis
To manage your personal finances with InfoQube, 2 approaches are possible: Full InfoQube or hybrid InfoQube + Excel:
Either way :

Solution: Use InfoQube to enter revenues and spendings. Use InfoQube or Excel to calculate balances and perform analysis
To manage your personal finances with InfoQube, 2 approaches are possible: Full InfoQube or hybrid InfoQube + Excel:
Either way :
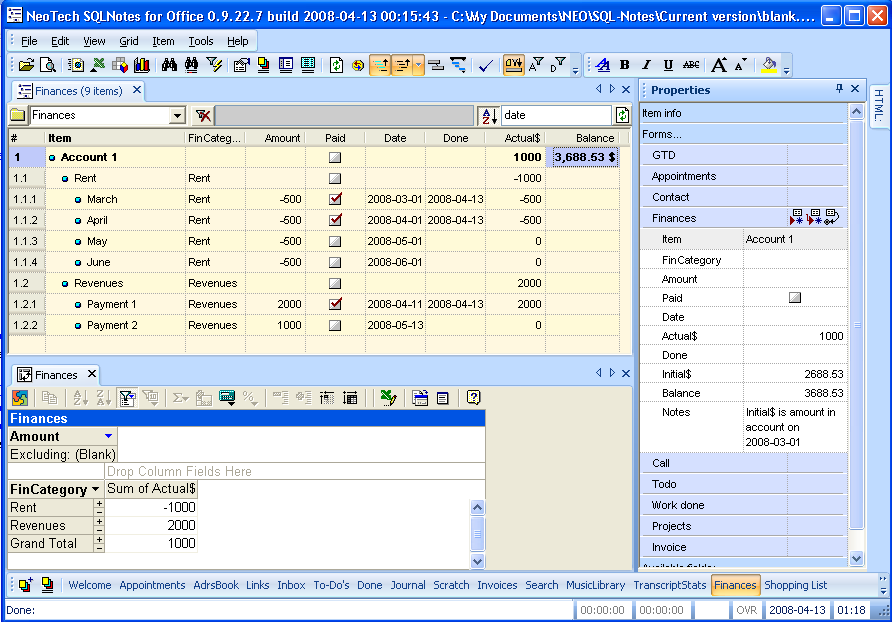
- Create a number field: Amount. +ve numbers would be Credit and -ve numbers would be debit. (or invert it as you prefer)
- Create a number field Actual$ with equation = ZN(- [Amount] * [Paid]). (Paid=true is equal to -1). So the Actual$ would be the amount paid/received.
- Organize it under parent heading (Account 1, Invoices, Rent, Cash, etc ) if you wish.
- You can use the DateFilter toolbar to easily filter on a specific date range (change the source to amount for this)
.
- Set-up Account 1 as parent item. You can have grouping items too if you wish (Rent, Revenues, etc)
- I recommend a category field (Revenues, Car, Home, Food, etc) since this will allow the pivot table to group spendings by category. You can set Value --> sub-items for this field to have the category automatically filled
- Set the Actual$ field Parent = SUM(Children)
- Create a number field: Initial$ with Null=0 Unchecked. This will ensure that the balance is calculated for the Account item only. (An alternative would be to simply add a sub-item to your account with the starting balance)
- Create a number field Balance with equation = Initial$ + Actual$
- For the Paid field, set auto-assign rule: A:Done=int(now) | E:Done= . This will today's date in the done field when you check Paid (Optional)
- Create a form with all relevant fields: Item, FinCategory, Amount, Paid, Date, Actual$, Done, Initial$, Balance, Notes
.
- Set the source of your grid to Amount. This will display all items that have an amount. Since InfoQube can only display the immediate parent (this will be improved), Either display the ItemParent field or keep the outline to just 2 levels: Account -> transactions
- Create an ODBC Source for your InfoQube file. Use the MS Access database driver (Help available if needed)
- In a blank Excel file, Cell B10 (approx), Do Data > External Data > New Database Query
- Select the ODBC connection you just created.
- You'll be presented with a list of queries, an InfoQube grid is actually a query. So select your current grid name from the list. Expand the + and copy all fields to the right pane (to select those fields)
- Hit OK until you get back to Excel
- You'll then see your InfoQube grid data in Excel. This is not a copy but a live link.
- Above your data block in Excel, you can enter equations and initial values to compute your balance. To the right of the data, you can also enter equations to calculate running totals (i.e. daily balance). Make sure that your grid is set to sort on Date or your balance will not be calculated correctly
- To refresh your data in Excel, right-click > Refresh Data
.
