A Quick Introduction to InfoQube

InfoQube is an Information Management System that provides all the tools you need to simplify your life:
- Calendar
- Multi-column Outliner Grids
- Gantt and Timeline Charts
- 2-D Surface
- Card View
- MapView
- Pivot Table and Charts (when Office 2000+ is installed)
- WYSIWYG Rich-Text, Markdown and Handwriting pane
- Live-Search
Rather than forcing you to accept predefined categories, InfoQube gives you the tools to create your own organizational structure:
- Record and view information in one of the many InfoQube views
- Use InfoQube to cross-reference information and associate values with this information
- Use InfoQube to collect Web clippings and use the built-in rich-text editor to edit this content
- Share this information with other users
Increase Your Productivity with InfoQube
InfoQube can be used to easily perform many daily tasks which are complicated with current main-stream office-like suites:
- Manage your appointments and meetings and add an infinite amount of notes specific to that item, using one of the 3 built-in features:
- User-defined Fields: Add text, numbers and dates values to each item
- Rich-text Outliner: Add multi-level outlining notes using the built-in advanced rich-text outliner
- WYSIWYG Word Processor: Add fully formatted text to each item (including support for bullets, images and tables)
- Manage your contacts and sale leads using the Address Book:
- Enter as little or as much details as you wish for each contact. No limits to the number of email adresses and phone numbers
- Organize your contacts in hierarchy (Company > Contact).
Doing it this way, you only need to enter the Company phone numbers once and the built-in phone dialer will find this info for all contacts under the company.
Contact specific phone numbers will be presented first, followed by Company ones. - Quickly find contacts using any combination of:
- One-click alpha-numeric filter (e.g. to only show contacts starting with the letter F)
- Search box: enter part of a name and hit enter to get a filtered list
- Easy grid and column filters. Hit CTRL-G to filter
- Auto-Search: Just type in whatever column and matching items will come in focus. F3 will move to the next item. CTRL-F3 to toggle
- User-defined fields (Work, Personal, Due, Hot, etc)
- Sort your contacts by (all methods support multi-key sorts)
- Clicking on the column header
- Drag a column header to the Sort bar
- The Sort criteria
- Assign user-defined values to your contacts, to be used in filtering and sorting
- Use field equations to automatically flag contacts:
- Compute a value based on when the contact was last contacted
- Flag contacts those in due of a follow up (i.e. x days after last call)
- Flagged contacts can be shown in a separate list and/or color highlighted
- Enter the new call (or email) information and automatically have the contact removed from this "flagged" list (if desired)
- Enter outlining notes regarding this specific call to this contact
- Assign tasks, appointments related to this call
- Assign these to yourself or to co-workers
- Manage your tasks more effectively:
- In a work-group environment, view only your tasks, tasks you've assigned to others, etc
- Use the Gantt Chart display to graphically view your tasks and:
- Move tasks, change duration
- Add dependencies simply by dragging a link between the two using the mouse (e.g. one task must be completed before starting another one)
- Only show tasks that you can do now (hide tasks that have non-completed dependent
- Show work-load graph (helps getting extra resources and/or move tasks to avoid overtime and better predict delivery dates)
- In multi-user environments, view how tasks and info must move from one worker to another (using the Group By features)
- Enter Due Date, Duration, Effort Required and %Done
- Compute earliest delivery and critical path
- Get tasks flagged when due date is approaching / passed (color coded)
- See tasks start and / or stop in the Calendar
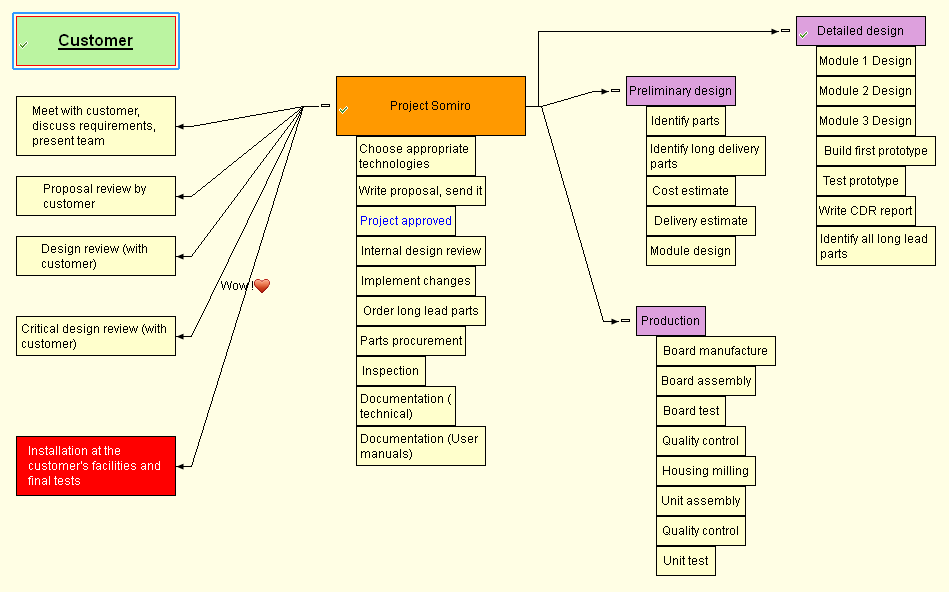
- Manage all other types of info using InfoQube Grids:
- Use InfoQube fields to organize information into virtual folders
- Specify which folders are displayed in each grid
- Organize the information in collapsible outlines
- Hoist to focus on one or more branches
- You can even put an item under many parent items
- Use the new Surface View to emphasize specific items in 2-D:
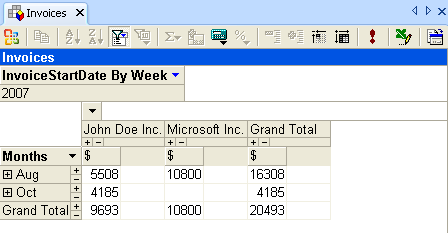
- If MS Office 2000+ is installed, you can use Pivot tables and charts to:
- Compute monthly totals, project totals, etc
- View aggregate info from different dimensions
- Create visually pleasant charts
- Export these to HTML files to share with others and/or publish