Gantt Charts and Project Management
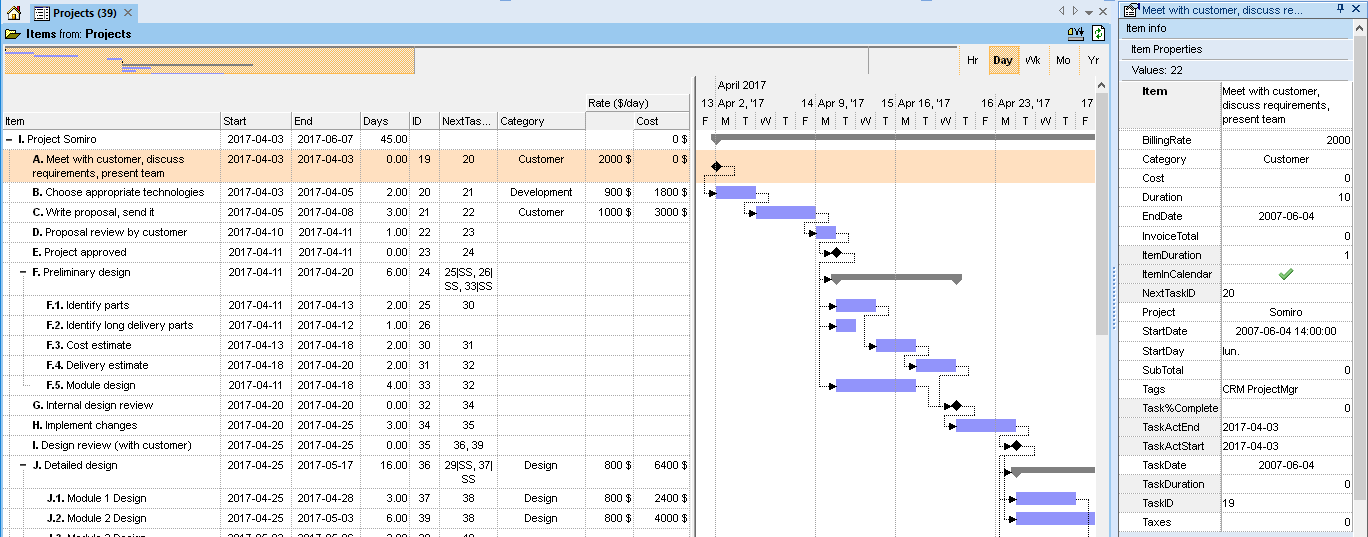
When it comes to Project Management, InfoQube is not as sophisticated as specialized tools like Microsoft Project or Primavera, but it nevertheless provides extensive project management tools. One of which is sophisticated Gantt charts:
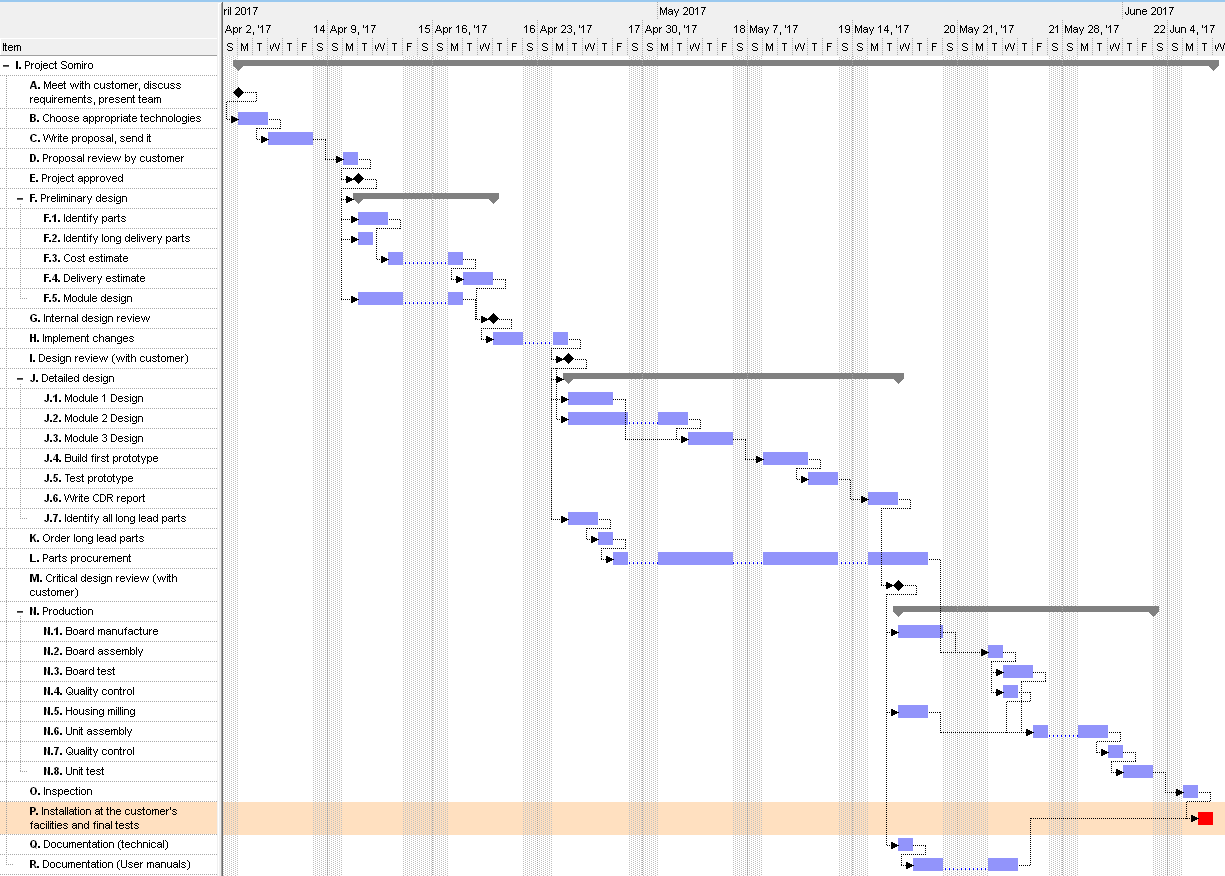
Being fully integrated with the rest of InfoQube, its Gantt Charts are in some ways even move useful than those of the "big guys" !
1. Gantt Specific Features
- MS Project look
- Multiple Gantt charts per IQBase (related or unrelated)
- Customizable time scale, from hours to years
- Configurable to use "stock" fields or your own set of fields
- Task Start, Task End, Percent Done fields
- Option to use Bar Caption, Task Effort, Bar Color fields
- Optional Overview to show the whole project, for easy navigation
Optional work load profile below the Gantt- Non-working days support. Either shown in grey or hidden from view.
Tasks duration is maintained (So a 3 day task will take 5 calendar days if it crosses a week-end for example) - Arbitrary non-working days: Set any day as a non-working day (i.e. statutory holidays)
- 3 bar types: Task, Milestones, Summary
- All standard Task Link types (dependencies): FS (default), SS, FF, SF (See Wikipedia def.)
- Full support for Lags between tasks (+ve and -ve lags). So a task can be set to start 2 days after another one completes, or 3 days prior
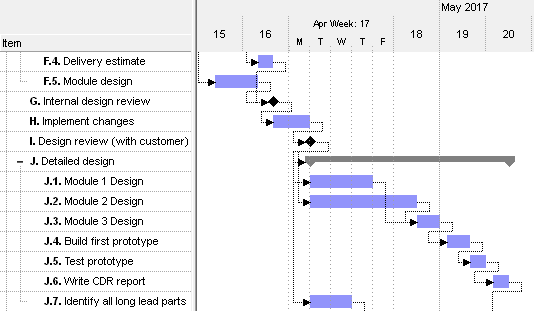
- Inside-Zoom and Zoom-on-Fly to show more details for certain tasks:
- 3 modes to manage linked tasks: Visual display only, Enforce Task Dependencies, Locked
- Show / hide link lines
- Option to freeze started tasks, so they cannot be moved
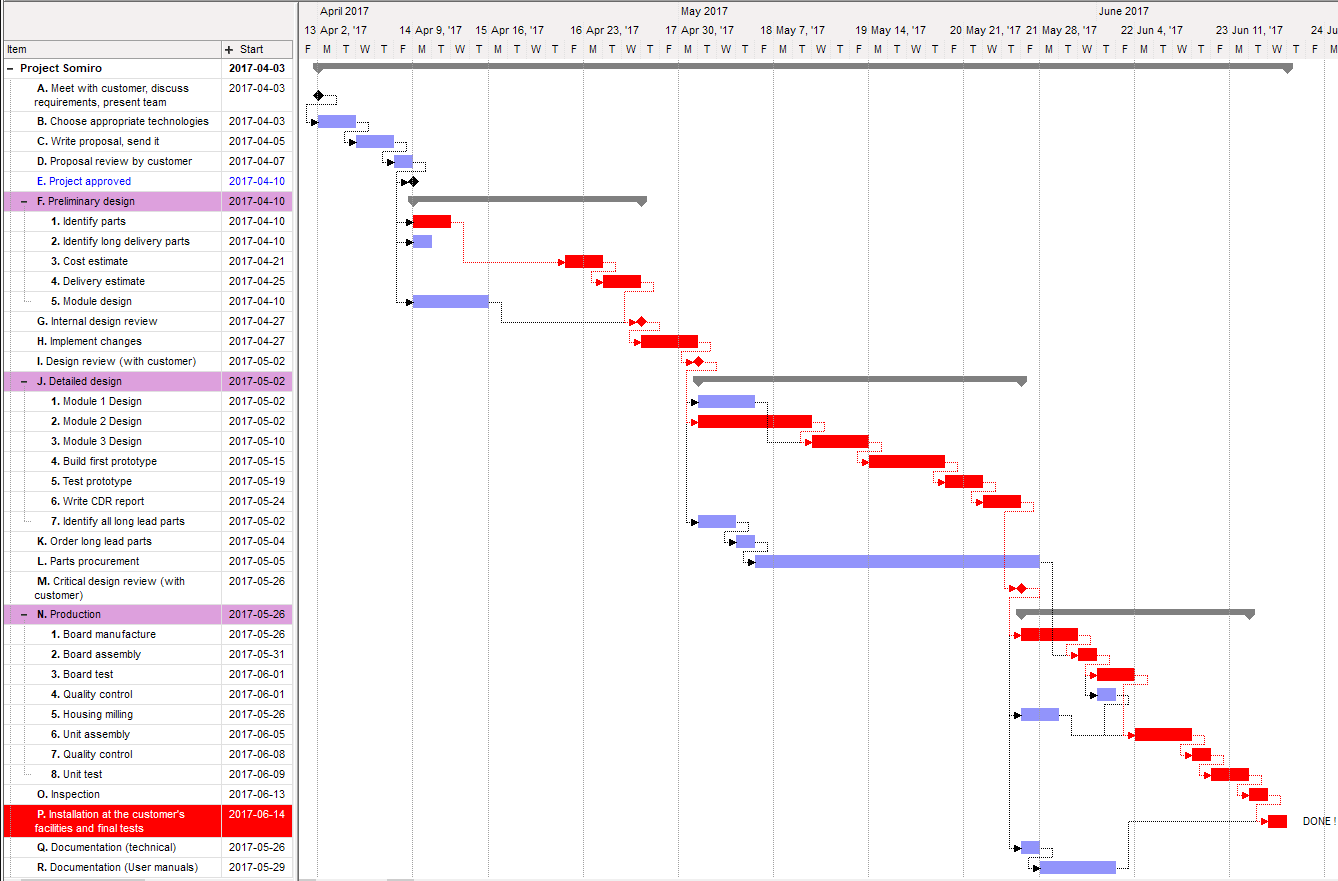
- Automatically rearrange tasks based on tasks, links and lags to calculate the earliest delivery (PDM / CPM optimization)
- Critical Path display: Find where the bottlenecks are to deliver on-time:
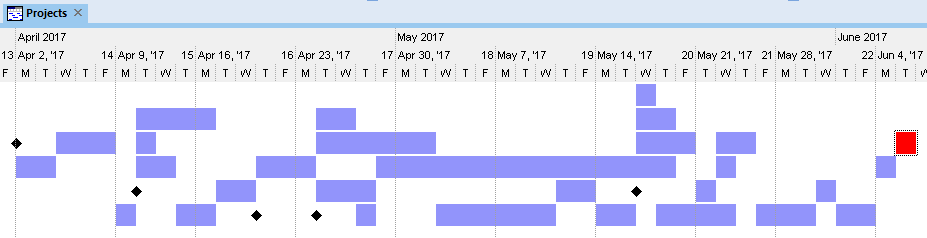
- Compact TimeLine view to quickly see what should happen when:
2. It's a Grid too, so...
Being a standard grid, all of these can also be used to optimize project management:
- Unlimited number of columns
- Unlimited number of sub-items
- Multiple Parents
- Filter by any column
- Hoist specific items
- View tasks in other grids
- Print Preview
- Save as PDF, Image
3. Tasks are items
Each task is just an IQ item, so like any other item, you can:
- View task start and task end in the Calendar, color coded (green=start, red=end)
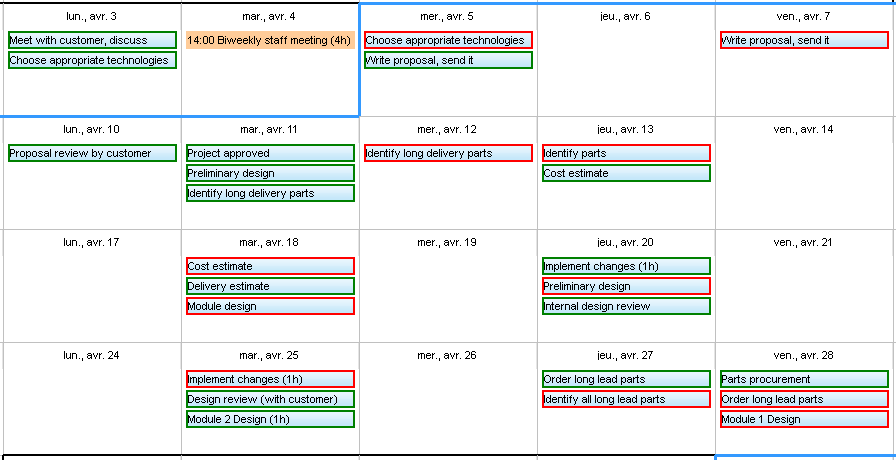
- Late or near late tasks can change color (see the built-in Urgency field). This color code is shown everywhere in IQ, not just in the Gantt
- Add associated rich text notes, Web pages, Drawings, Ink documents, etc. in the Doc pane
Perfect for brainstorming, design notes and other handwritten content. Details here: Using Ink Documents
And the Ink editor now supports real-time remote multi-user collaboration (web server based)
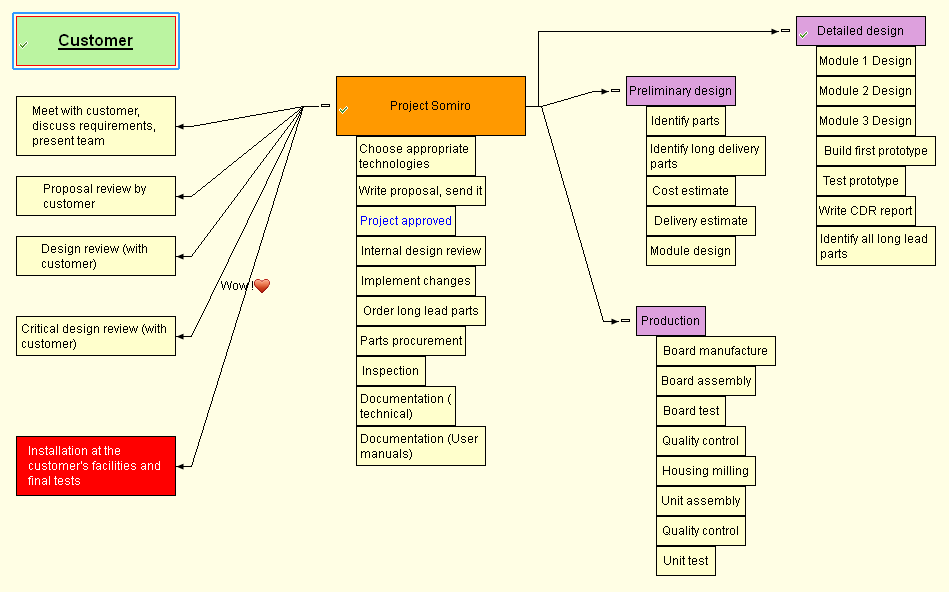
- View the whole project, or sections of, on the new 2-D IQ Surface !
4. Multi-User and Dropbox Sync Ready
- Finally, IQ is multi-user ready when used in a LAN environment, so it supports team work.
- And with Dropbox-sync, you can have your projects at work and at home.
5. How-To:
- Create a bar: 2 ways:
- On an existing item, enter a value for the task start and / or task end fields
- In the chart area, click and drag from the start to the end date. If done on a blank area of the chart, a new item will be created
- Create a milestone: Clear the task end date or set it to the start date
- Create a summary bar: Right-click on an existing bar and select "Is Summary Bar"
- Link 2 tasks: 2 ways:
- Enter a taskID in the NextTaskID field
- Click on the first bar and move down to the second bar. A dialog will be shown:
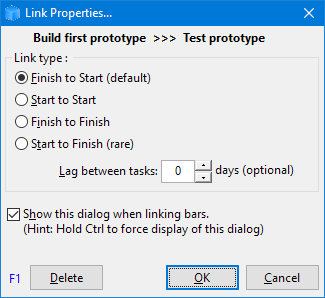
- Select the link type and lag
- Uncheck "Show this dialog" to automatically created a FS type link
- Delete a bar or a milestone: Click to select 1 or more bars / milestones. Right-click and select Cut (or press Delete)
- Move bars: Select 1 or more bars and:
- Click and drag to a new position
- Press Alt+Left/Right arrows to move by 1 day
- Delete a link:
- Delete the value for the field NextTaskID
- Right-click on the link and either select Delete Link or use the Link Properties dialog and click Delete
- Change the bar color: Right-click on a bar and select "Bar Color"
- Change the Gantt Scale: Any of:
- Drag the Zoom scrollbar in the Gantt menu
- On the Overview bar, click on one of the scale button
- Ctrl + Mouse wheel while over the chart
- Drag the top level separator line left / right (=zoom out / zoom in)
- Show the Zoom-on-Fly window: Press Ctrl and Shift and hover over a bar
- Set a day as non-working: Right-click on the day in the chart header and select "Is a non-working day"
- Move the focus between the Grid and Gantt panes:
- Shift+Alt+Right arrow moves focus to the Gantt
- Shift+Alt+Left arrow moves focus to the Grid
- Scroll the chart: Use any of the following methods:
- Shift + Mouse wheel while over the chart
- On a precision touchpad, two-finger swype left / right
- If Gantt > Auto-Scroll is On, simply select the task. The chart will scroll to show it
- Double-click in the chart area of a task. Chart will scroll to show it
- With focus on the chart, use Left/Right arrows to scroll
- With focus on the chart, use Ctrl+Left/Right arrows to intelligently scroll from task to task in chronological order
A vertical line is drawn in green for task start and in red for task end
The status bar show the number of days between tasks
Press Escape to return to the blue vertical indicating the current date
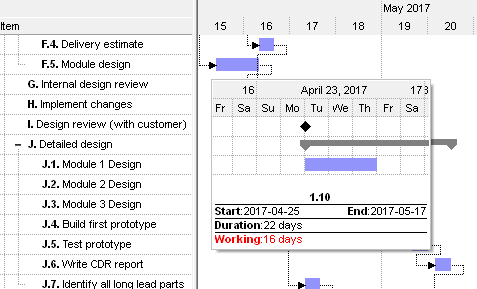
- Bar start and end dates, duration information:
- Shown on the main status bar. Click a bar to view it
- Shown as a tooltip on mouse over while holding the Ctrl key.
6. Notes
- InfoQube also supports non Gantt-based task dependencies. See 2. Task Dependencies for details