Dashboards
Dashboards are grids which have a fairly large number of panes. They can serve many uses:
- Window showing all aspects of a project
- Multi-view of most common information, all in a single window
- Kanban-style task management
- GTD task management
- To have a Doc pane attached to a specific tab. It will display the rich text content of the selected item in this tab
Creating Dashboards
Dashboards are normal grids to which one adds any number of panes:
- Choose an existing grid or create a new grid. The name of this grid will be displayed in the workspace as a tab
- Use any of the following methods to copy a view:
- Manage Grids: Right-click on a grid > Copy View
- Right-click on an existing tab > Copy View (supports non-grid type views)
- Right-click on an entry in any of the grid list dropdown menus (View > Grids, Recent Grids, etc) > Copy View
- Back in your Dashboard grid, right-click on the workspace tab > Paste View > Paste as a pane (1)
- Repeat for each view (grid, calendar, card, etc) to be added to the dashboard
- To add a Doc pane, do View > Document > Add Document Pane > 1- To the Current Tab
- At any time, panes can be freely moved inside the dashboard, docked to one side and/or stacked in collections (with bottom shown tabs)
- For more information on pane management / possible setups, etc, see Pane manipulation in IQ (and sub-pages of this page)
Sample Dashboards
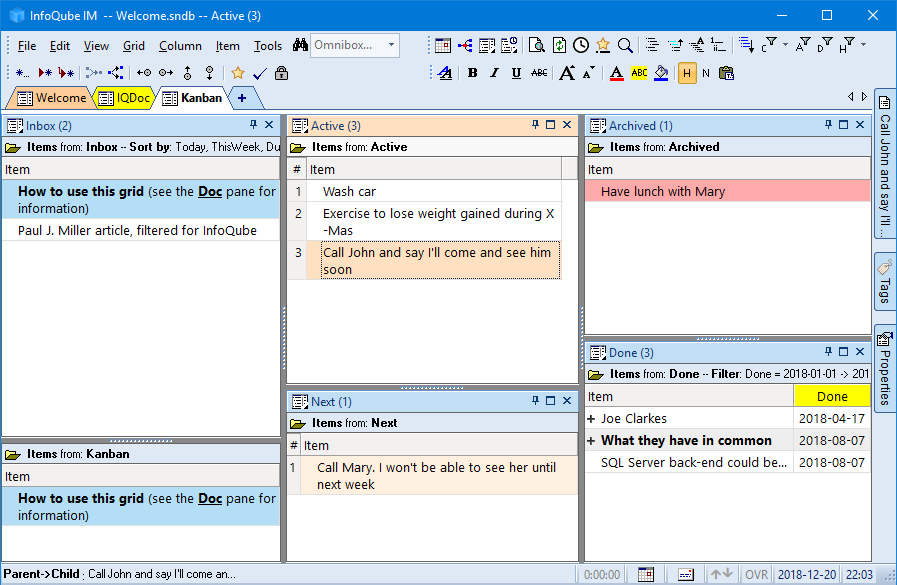
1. Kanban-style task management
In a Kanban board, activities revolve around dragging items from one pane to another
- Dragging items from one pane to another automatically sets field values, such as Active, Next, Done (date)
- Grids support sorting, either manual or based on field values (such as DueDate, Priority, etc)
- InfoQube makes it easy to drag-drop items and even supports dragging many items at once