Case: You have informal basketball games at lunch and want to keep track of the wins and losses of each player. You want to be able to quickly see which player(s) has better stats.
Solution: Use InfoQube and have each player enter their score after lunch.
In this example, we'll learn how to:
There can many ways to go about this, all with advantages and disadvantages. We'll describe one method which shows many of the built-in features of InfoQube.
The first step is to create some fields to store the information:
Now that we have created the fields to store the information, we'll create a grid to show/enter the data.
A new grid is created. The last thing we need to do is to display some columns.
At this stage you should see something like this: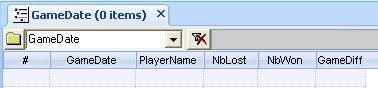
You are now ready to start entering results. For 2 days of data, it might look like this: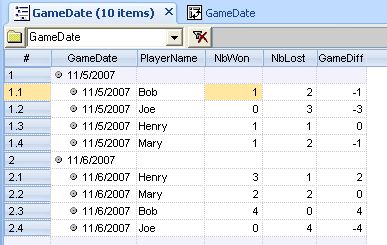
The GameDate is entered only one (for the game) and is automatically transfered to each player's score (this is optional and only there to allow us to calculate stats over a given period of time. This may not be a requirement.).
Also, the PlayerName is entered once. Subsequent days, the player can pick from a drop-down list.
The data is entered by only one person or by many. InfoQube is based on a multi-user database, so many users can be working on the same database, at the same time.
To share the database, simply put the InfoQube file (*.SNDB) on the LAN. That's it!
The final step is to create the pivot table to calculate the statistics. This requires MS-Office 2000 and up installed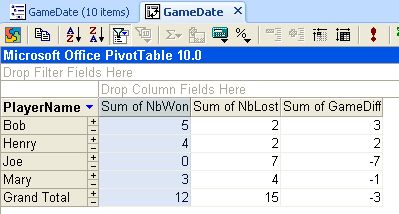
This shows that Bob and Henry have the best score, followed Mary. As for Joe, well, he's got some catching up to do...
The Pivot table properties window can be used to customize the pivot table. The final BasketBall stat application could look like this: 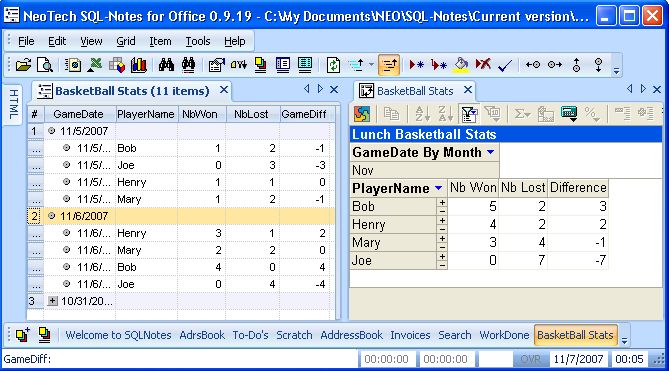
The default template has been updated to include this sample.
Using an alternative application structure, the following could also be done in InfoQube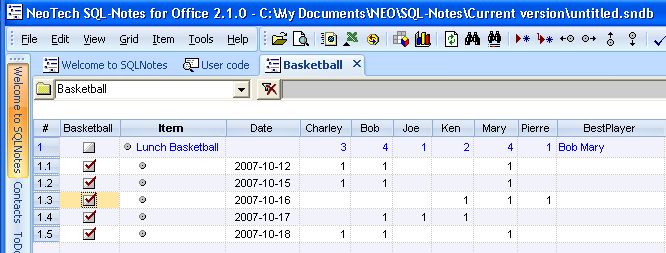
Solution: Use InfoQube and have each player enter their score after lunch.
In this example, we'll learn how to:
- Create fields to store players and results, including pop-up text list, dates and number fields. Default field values, inheritance and equations will be used
- Create a grid to add/view the game results
- Create a pivot table to summarize the results and determine players with the best won ratios per month
- Set it up to allow multi-user access
There can many ways to go about this, all with advantages and disadvantages. We'll describe one method which shows many of the built-in features of InfoQube.
The first step is to create some fields to store the information:
- View > Field management.
- Create a field PlayerName to hold the name of each player. Check Auto-list. Click Save
- Create a field NbWon. Set the datatype as number. You may set the alignment to right. Click Save
- Create a field NbLost. Set the datatype as number. You may set the alignment to right. Click Save
- Create a field GameDiff.
- Set the datatype as number.
- Set the equation: = nbWon - nbLost.
- Check Read Only.
- You may set the alignment to right. Click Save
- Create a field GameDate.
- Set the datatype to Date.
- Set the default value = int(now). This will default the game date to today
- Set Alignment to centered
- Check Value-->sub-items. This will allow us to use the pivot table to calculate the stats, since the player's score (i.e. the sub-item) will inherit the date.
Now that we have created the fields to store the information, we'll create a grid to show/enter the data.
- Do View > Grids > New Grid. Set the grid name to GameDate (select from the list). Click OK
A new grid is created. The last thing we need to do is to display some columns.
- Do Grid > Displayed columns. Check GameDate, GameDiff, NbWon, NbLost, PlayerName. Click OK
- The Item column is not needed in this application, so right-click on the column heading > Hide Column
- We'll set the tree column to the GameDate: right-click on the GameDate column header > Set Tree Column
- Finally, you need to do Grid > Hierarchy to tell the grid to enforce parent-child display
- If you want to rename the grid, to BasketBall Stats for example, do Grid > Properties and change the name
At this stage you should see something like this:
You are now ready to start entering results. For 2 days of data, it might look like this:
The GameDate is entered only one (for the game) and is automatically transfered to each player's score (this is optional and only there to allow us to calculate stats over a given period of time. This may not be a requirement.).
Also, the PlayerName is entered once. Subsequent days, the player can pick from a drop-down list.
The data is entered by only one person or by many. InfoQube is based on a multi-user database, so many users can be working on the same database, at the same time.
To share the database, simply put the InfoQube file (*.SNDB) on the LAN. That's it!
The final step is to create the pivot table to calculate the statistics. This requires MS-Office 2000 and up installed
- Do Grid > Pivot Table. All steps now use the toolbar which is just above the pivot table
- Click on the Fields button.
- Drag the PlayerName to the "Drop Row Fields Here" area on the pivot
- Drag the NbWon to the "Drop Totals or Detail Fields Here" area on the pivot
- Repeat for the NbLost, and GameDiff field
- For each of these, right-click on the heading and set AutoCalc to Sum
- Click on the Sum of NbWon heading to select it and the Hide Details button on the toolbar
- Click on the drop-down arrow to the right of PlayerName and uncheck (blank)
At this stage you should have this:
This shows that Bob and Henry have the best score, followed Mary. As for Joe, well, he's got some catching up to do...
The Pivot table properties window can be used to customize the pivot table. The final BasketBall stat application could look like this:
The default template has been updated to include this sample.
Using an alternative application structure, the following could also be done in InfoQube
:
This organization is more compact, does not require the use of the pivot table to calculate the best player. However it requires a field per player and some user-defined code to determine the best players.
This organization is more compact, does not require the use of the pivot table to calculate the best player. However it requires a field per player and some user-defined code to determine the best players.